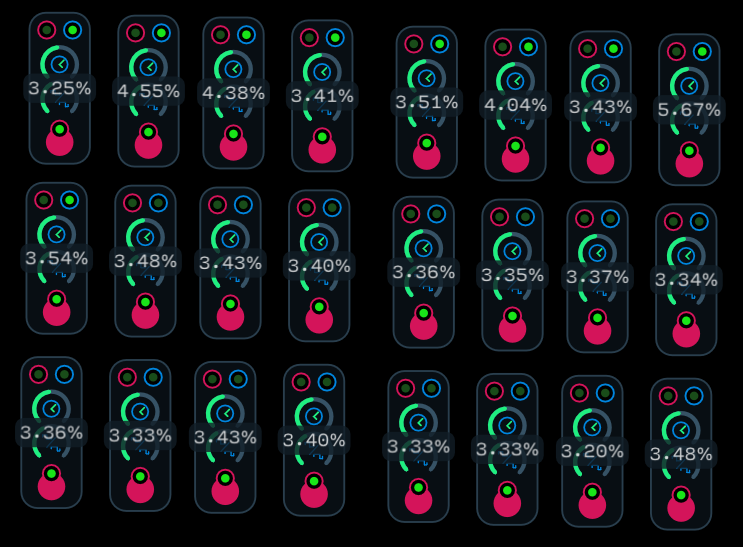
I have been thinking about how to quantify the cpu usage of a given module as part of the information presented with my modules. I was thinking about rating things in comparison to the library clock object as it seems like a module that is unlikely to change significantly. However, while testing the idea, I noticed that some of the clocks use more CPU than others. These are all copy and pasted, so I wonder if there might be some explanation for this.
1 Like
My guess would be a sampling error due to the internal process Audulus uses to calculate the CPU usage. Having a lot of copies of the same thing might not be such a great test. How consistent is just one copy of the clock?
2 Likes
I’ve noticed the same thing. Two copies of the same module can vary by 50%
2 Likes
The time measurement code is fairly straightforward. I’ll make such an example to test it more thoroughly.
Some potential reasons why we see the differences:
- A bug in reporting the underlying measurements (seems unlikely, but I will test)
- Memory locality of the DSP objects means some are more cache-friendly than others (I’m going to address locality issues in Audulus 4)
- Different node execution order (there are multiple equivalent orders) leading to some modules being more optimally ordered than others.
- The mysteries of modern CPU architecture.
3 Likes
Dual multi-core computers do generate a lot of complexity.
1 Like
Yeah. I could burn a lot of time diagnosing this issue. It might be better to work on things we know will improve things (like memory locality) and see if this improves along the way.
3 Likes
I don’t think it’s worth a lot of effort. The usage figures are a help in identifying areas of a patch that might stand some improvement, but in the end it’s the overall load that really matters. You can always run alternate designs as separate patches if you need to compare CPU load.
1 Like
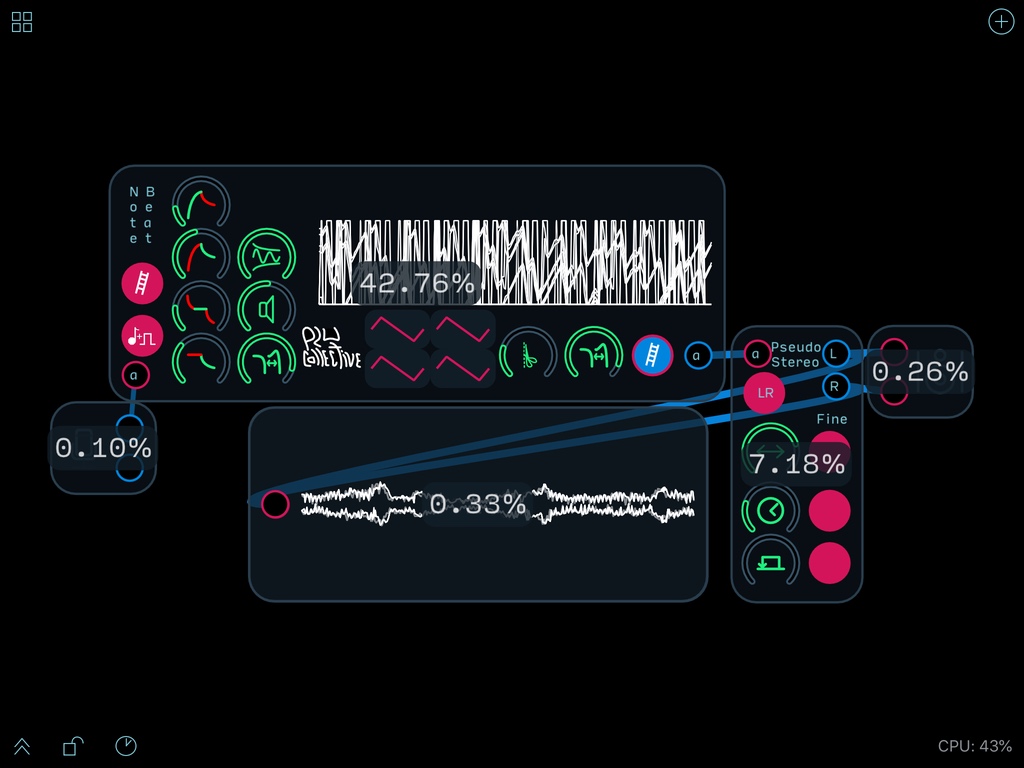
Here’s a more significant glitch with the CPU usage in Audulus 3. There’s about a 7% greater value for the CPU total for the modules than the grand total for the patch in the lower right hand corner.
I agree that trying to track down the source of these inconsistencies isn’t as valuable as improving your patches overall performance.
1 Like
@Taylor correct me if I’m wrong, but from my understanding this discrepancy is explained this way:
Each node/module % is the a percent of the total CPU Audulus is using. The CPU% value in the corner is the total percent of your computer’s processing power Audulus is using.
What’s not included in the estimations of the node% is the background CPU Audulus is using to run itself, which is why the nodes together never add up to 100%.
What we’ve noticed is that if you copy a module and connect in an identical fashion, often the percentages shown on each copy of the module are very different, even thought the modules are identical. @Taylor’s explanation regarding locality with respect to the CPU cache and execution order makes sense. I suspect that the numbers are accurate, and the multiple copies are actually using different amounts of CPU time. Having done my fair share of benchmarking, I can appreciate the difficulties involved particularly in a modern, multi-threaded environment.
Do they become identical when you clear history and restart the patch?
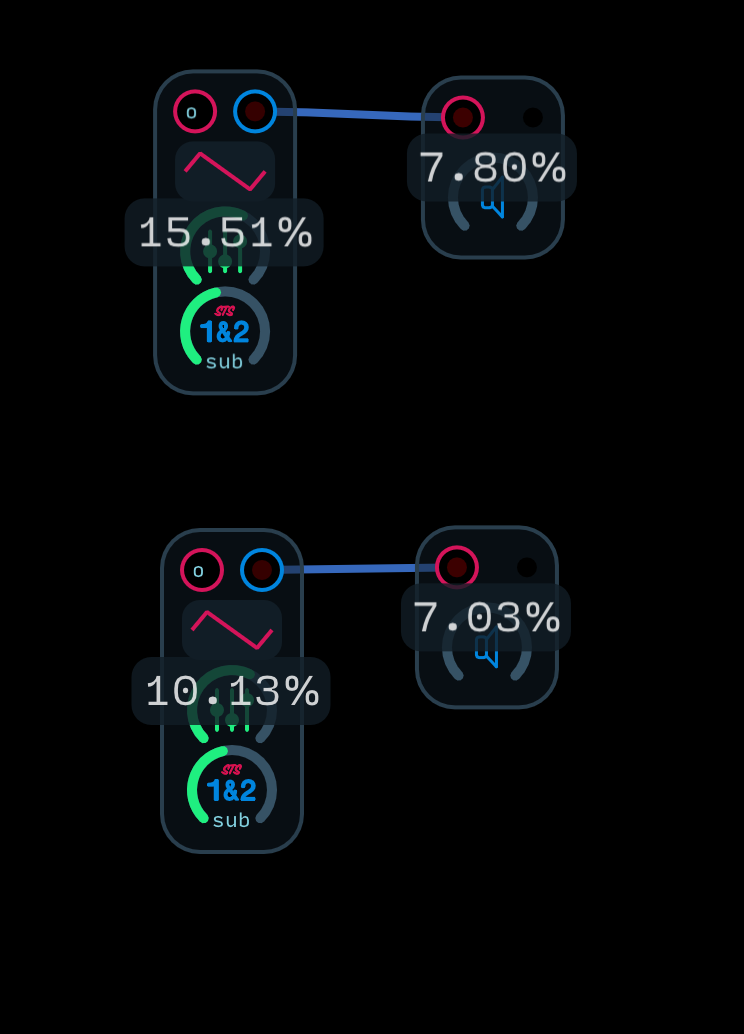
No even if you clear history and restart they are different. Here’s a copy and paste of an oscillator module and output module.
1 Like
Does it even out over time? It’s curious! 
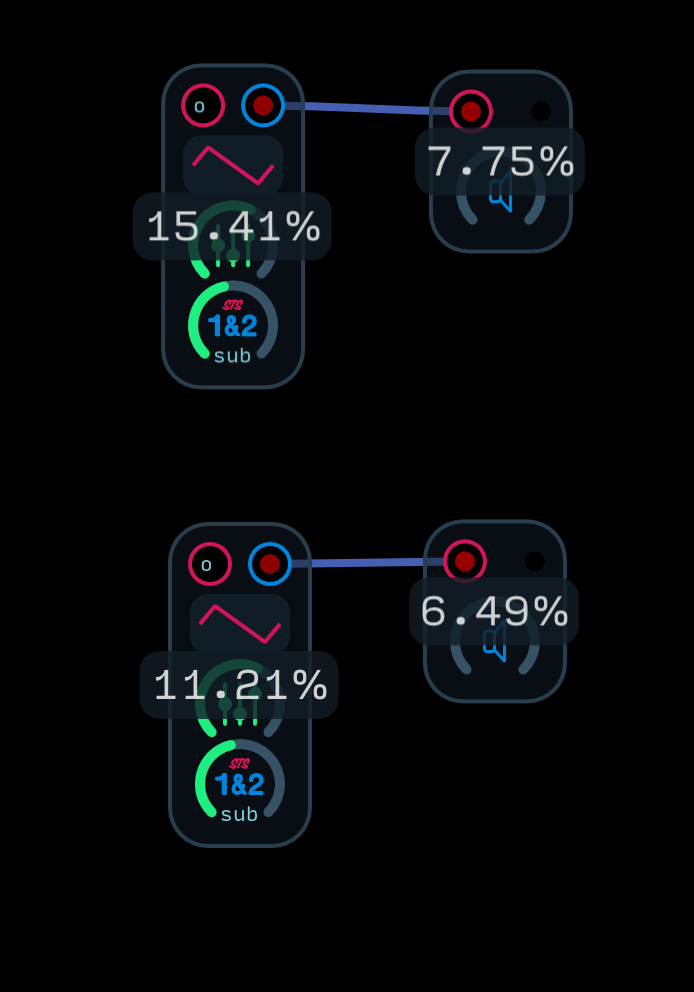
It’s getting there! haha
1 Like
The module percentages and the CPU load are two different things.
A module % is the percentage of time spent computing the module, out of all audio processing.
The CPU load is the % of time out of the maximum possible time to process a buffer before dropouts would happen. Dropouts will happen before 100% because of OS overhead. (Since folks expect to be able to go all the way up to 100% before dropouts, we probably should use a different UI for this).
If you add a single module to a patch, you might have the case where the module percentage is 90% (it takes 90% of processing time), but the CPU load is 5%.
I’m certainly open to ways of making this more intuitive
1 Like
Yeah that does seem to be at the core of the issue/confusion with people here and elsewhere.
I wouldn’t expect to get to 100% before issues occurred but perhaps I’m looking at things from a coder’s perspective. I’m happy to have both the total CPU load and relative percentages even if they are only a guideline. It’s nice to have some way to gauge whether a modification is an improvement with respect to CPU usage and it’s a rough guide as to whether a given patch will run on iOS when its been developed on macOS. Despite all the comments on the Forum, I don’t think it’s worth changing anything as far as the utilization display is concerned (unless of course you can make all the number go down lol). Your time would be far better spent on improving the performance (and everything else on your plate). Let us know when your new app debuts, I’m looking forward to checking it out!
1 Like
It’s good to understand what these numbers mean so that as @stschoen has mentioned we can use them as tools to guide our patch creation process.